Back

Finance and Asset Management
Optimizing and Enhancing component reliability on a Centralized Photovoltaic Power Plant with Data Monitoring
Tuesday, September 12, 2023
4:30 PM - 5:30 PM PDT
Location: Poster Area, Booth #11024, Level 1, Venetian Expo Hall

- JG
Joao G. Goncalves, n/a (he/him/his)
Project Coordinator
Radix Engenharia e Software
Rio de janeiro, Rio de Janeiro, Brazil
Poster Presenter(s)
Background, Description, Delivery and Learning Objective According to the International Renewable Energy Agency (IRENA), solar generating capacity increased 22% by the year of 2022. Brazil, for instance, has been one of the main investment targets for solar generation companies, due to its large territory, as well as the intensity and availability of solar radiation. 2022 marks Brazil’s first appearance on the top ten highest generations of solar energy.
Data analytics is crucial for the efficient operation of a photovoltaic plant. By analyzing data from various sources, such as weather conditions, solar radiation, and equipment performance, operators can optimize the plant's performance, reduce downtime, and improve energy generation. Data analysis can also help predict equipment failures and optimize maintenance schedules, leading to cost savings and improved performance.
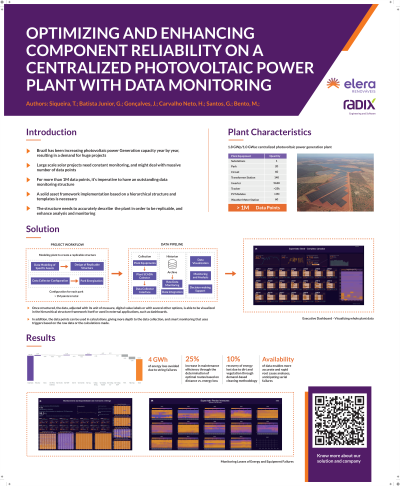
This project focused on collecting, managing, analyzing, and visualizing data from a range of equipment of a centralized photovoltaic power plant with a 1.18GWp/1GWac installed capacity, located in Brazil. The data collection started while the plants were still in construction stage, therefore, once energization happened, necessary values would be ready to be inspected. Providing data once operation started created an optimized workflow. With one photovoltaic park precisely described, it was automatically replicated to others on an asset framework. The effort was oriented towards improvement of asset management and O&M solutions.
The implemented optimized workflow, considering the energization schedule and the data availability, allowed the creation of an environment for monitoring of electrical variables from individual strings and intrinsic protections of the transforming stations, which made it possible both to help the commissioning of the plant as well as finding backlog of work to monitor the operational performance. This data monitoring and control provided faster commissioning and recovery of energy losses.
Full asset data integration provides important indicators, such as expected energy estimated on real-time irradiance and temperature. It supplies the user with both operational indicators and energy losses, due to unavailability, performance, operating restrictions, environmental or electrical losses. Performance is monitored in the smallest possible granularity, allowing the identification of hot spots, bypass diodes conducting, cracks in modules and others. This permits a more assertive and efficient management of the maintenance team. Monitoring tools and dashboards are widely used as a decision support method, from monitoring the operation to investment decisions. The accountable results of this application are an increase in performance and decision making by quickly analyzing all data available.
